Since April 2026, big software vendors have been publishing vulnerabilities at up to 12 times their 2025 pace. The industry calls what comes next the vulnpocalypse. Yet breaches have not moved.
A simple model, borrowed from forest fires, explains why. It also predicts where the damage will land next. I tested it on five data sources, from 380,000 published vulnerabilities to 4,600 hacking breaches in US healthcare.
The short version: what matters is not how much AI there is, but who has more of it. Where AI is pointed at code on the defenders' side, by vendors and by the researchers who report bugs to them, risk falls. Where nobody does, attackers get more lightning than ever.
Try it yourself. The Forest Fire of Cyber Breaches is an interactive version of this model: set how fast you patch, how much software you build yourself, how you scan it and how fast you catch attackers, and watch how your risk shifts. Like this article, it is a way of thinking about the problem with real numbers and simple models, not a forecast or a set of instructions. Its levels are calibrated to published breach frequencies by company size (Cyentia IRIS); its controls are simplifications whose effects are assumptions, so use them to compare, not to rate real products.
The model in one picture
| Forest | Cyber |
|---|---|
| Lightning | A vulnerability made public as a CVE, the public ID for a software flaw |
| A strike that ignites | A vulnerability used in real attacks |
| Fire | A breach |
| Fire size | People affected |
| Fuel, firebreaks, firefighters | Data in one place, network segmentation, detection and response |
In this model, lightning means vulnerabilities, and lightning is not the only cause of fire. Many breaches start with phishing, stolen passwords, pretexting or insiders, and many happen at partners and SaaS vendors that hold your data; vulnerabilities start only 12% to 31% of them.
For a vulnerability in code, whether in a vendor's product, a dependency or your own software, two races decide whether it becomes a fire, and AI speeds up both sides:
- The discovery race. The bug is hidden. If defenders find it first, it gets a fix. If attackers do, it becomes a zero-day.
- The patch race. The bug is public and a fix exists. Attackers try to use it before you install the fix.
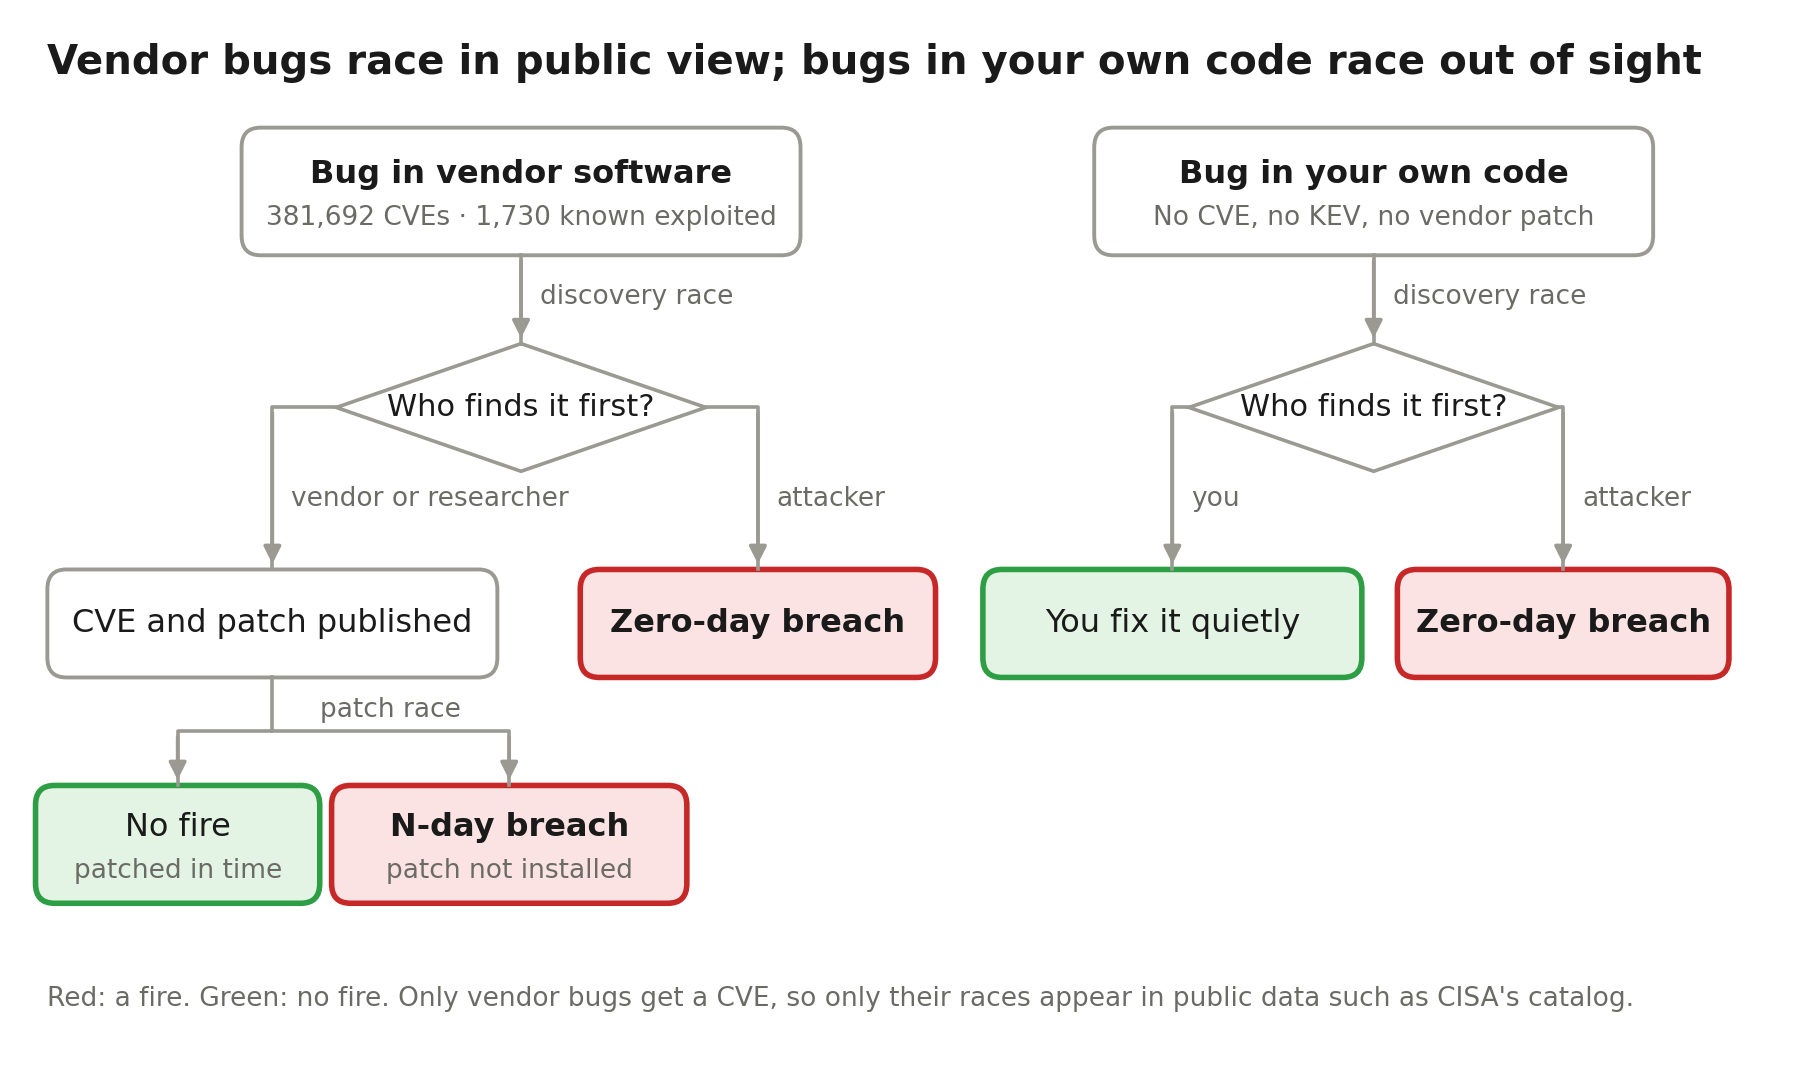
Vendor bugs race in public, where data can see them. Bugs in your own code race out of sight.
Why the fires are not growing
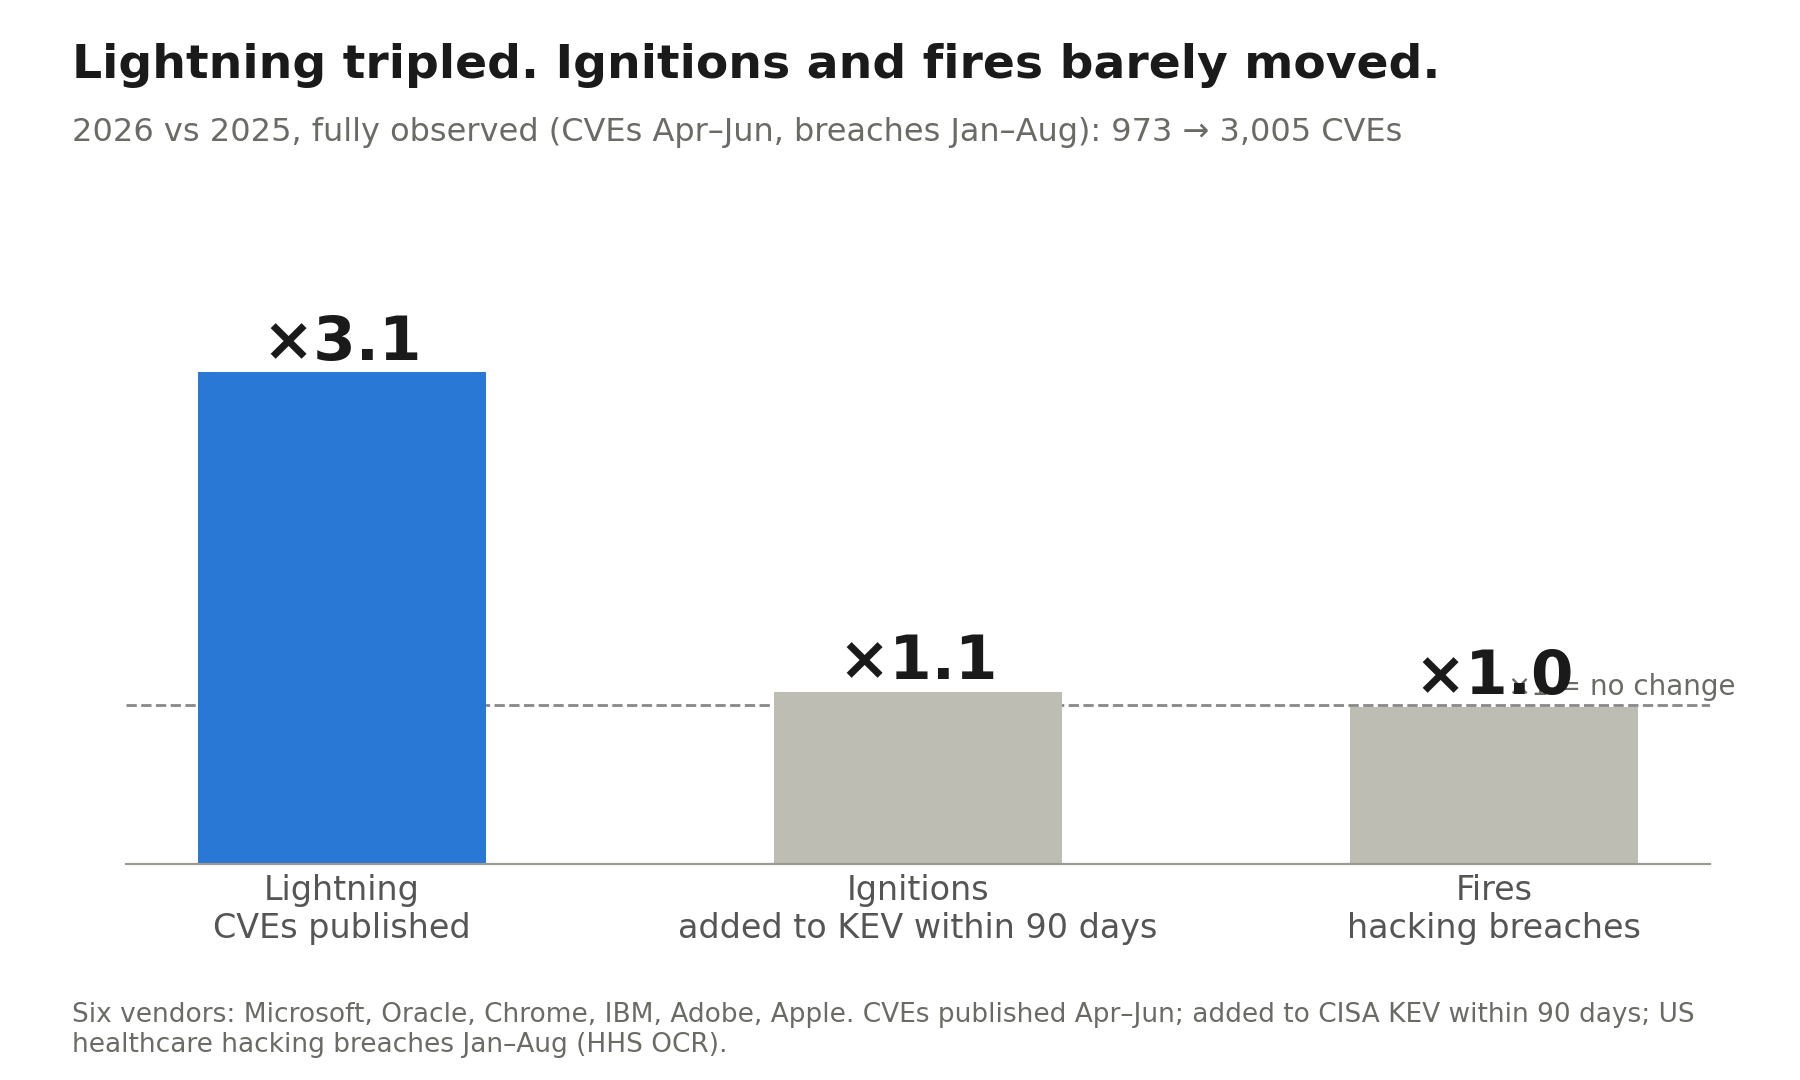
Six vendors: Microsoft, Oracle, Chrome, IBM, Adobe, Apple. CVEs published April–June; added to CISA's list within 90 days; US healthcare hacking breaches January–August.
- Lightning. Microsoft, Oracle, Chrome and IBM published about 2,300 vulnerabilities a month in July–September 2026, against about 200 in 2025. Microsoft credits AI-assisted discovery.
- Ignitions. CVEs from six big vendors tripled between April–June 2025 and April–June 2026, yet the number later listed as exploited stayed flat: 12, then 13.
- Fires. US healthcare saw 444 hacking breaches in January–August 2026, against 449 a year earlier.
The reason: most of these bugs are found by vendors or by outside researchers who report them, many now using AI, and the fix ships the day the bug goes public. The lightning strikes in the rain. An independent study by Root Evidence reached the same result.
Who has more AI
Among bugs that end up being exploited, attackers found roughly one in five to one in three before any fix existed. What happens next depends on who speeds up more.
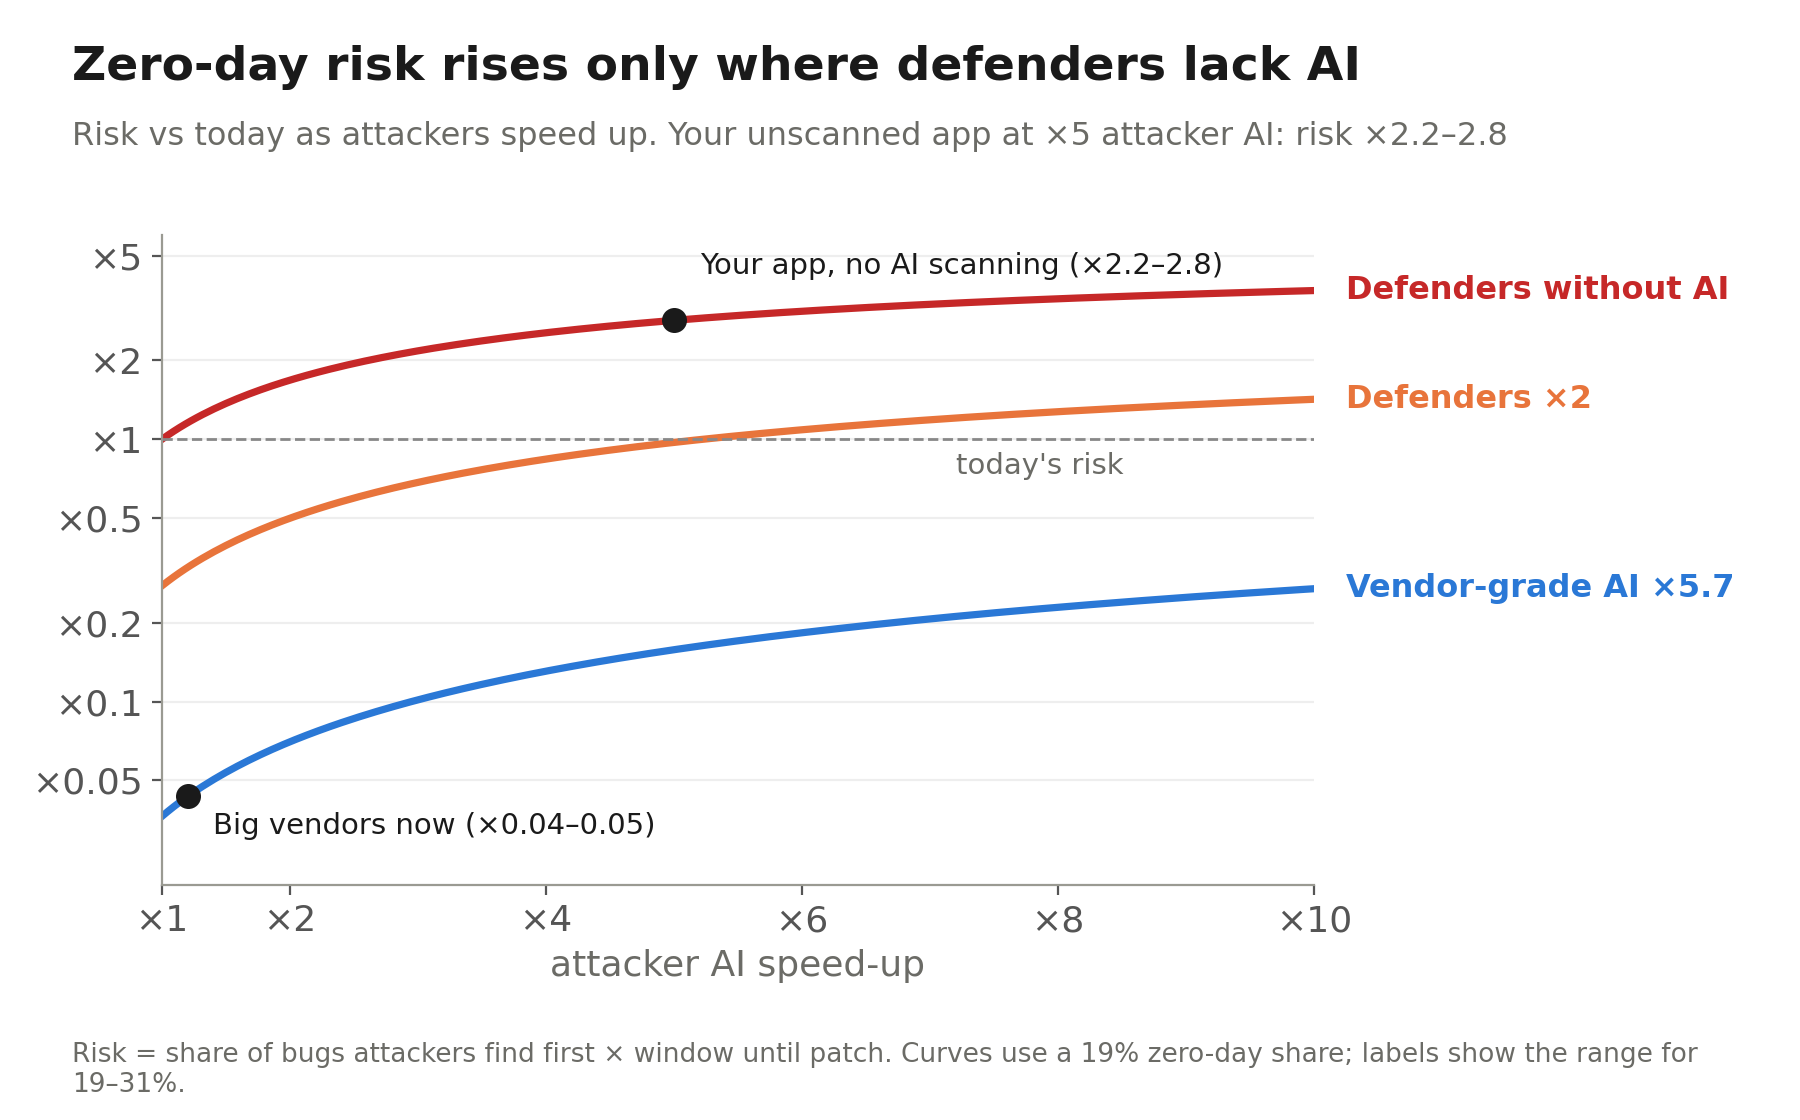
Big vendors, helped by researchers who report to them, now publish almost six times more bugs than a year earlier (April–September), and in the model their zero-day risk per bug drops sharply. Code that nobody scans goes the other way: if attackers get five times faster, its risk in the discovery race rises two- to threefold. If both sides speed up equally, the discovery race gets safer, but AI also helps attackers once they are inside, so overall risk only holds steady.
The first data is mixed. Zero-days at the six big vendors stayed flat at about 8 a quarter. At everyone else, they went from 7.5 to 12 in the second quarter of 2026, but the first quarter had only 6: over the half-year, both groups grew at about the same pace. The clear split appears only in the third quarter, after CISA changed its rules, so it may partly reflect the rules.
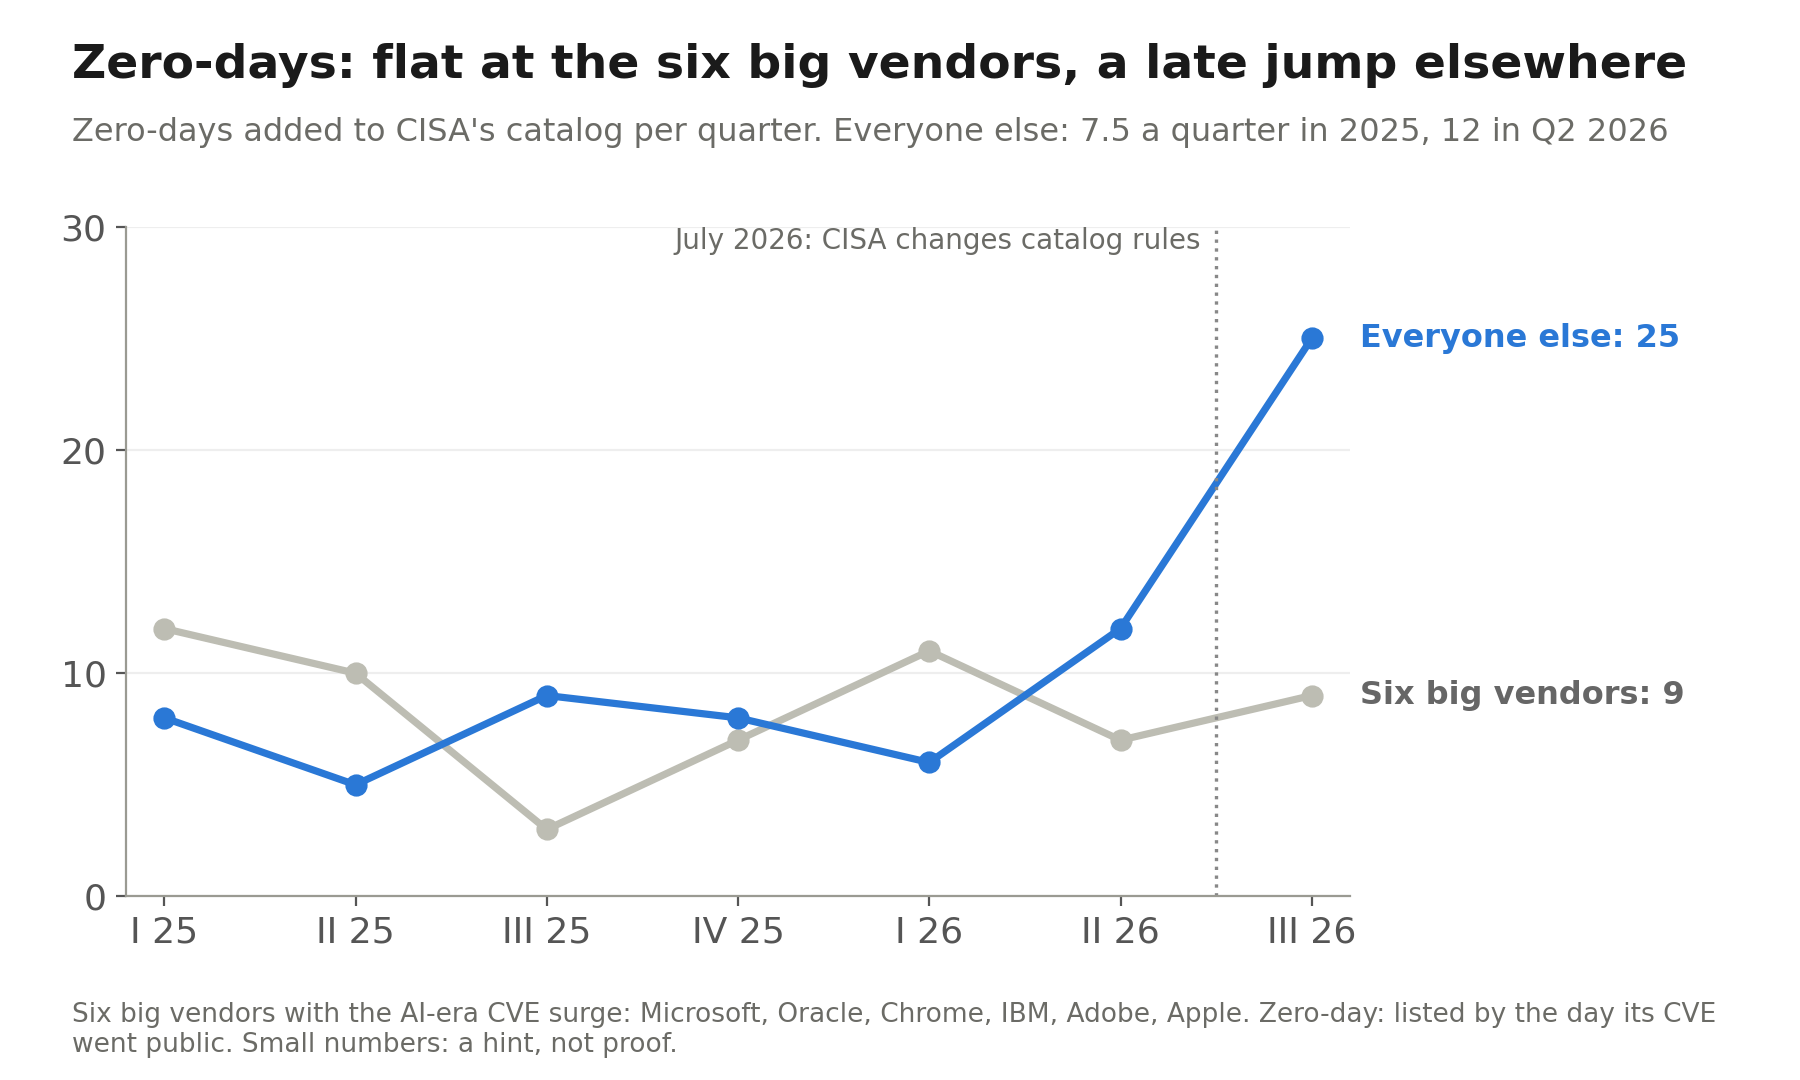
Zero-days in CISA's list per quarter. Small numbers: a hint, not proof.
Bug bounties add a clearer hint: money paid for real bugs rose 25% at HackerOne in the first half of 2026. If researchers with AI find more bugs, attackers with the same tools can too.
A few giants do most of the damage
Breach sizes follow a simple rule: a breach ten times larger is about ten times rarer. Forest fires show the same heavy tail. So a single giant can outweigh hundreds of ordinary breaches.
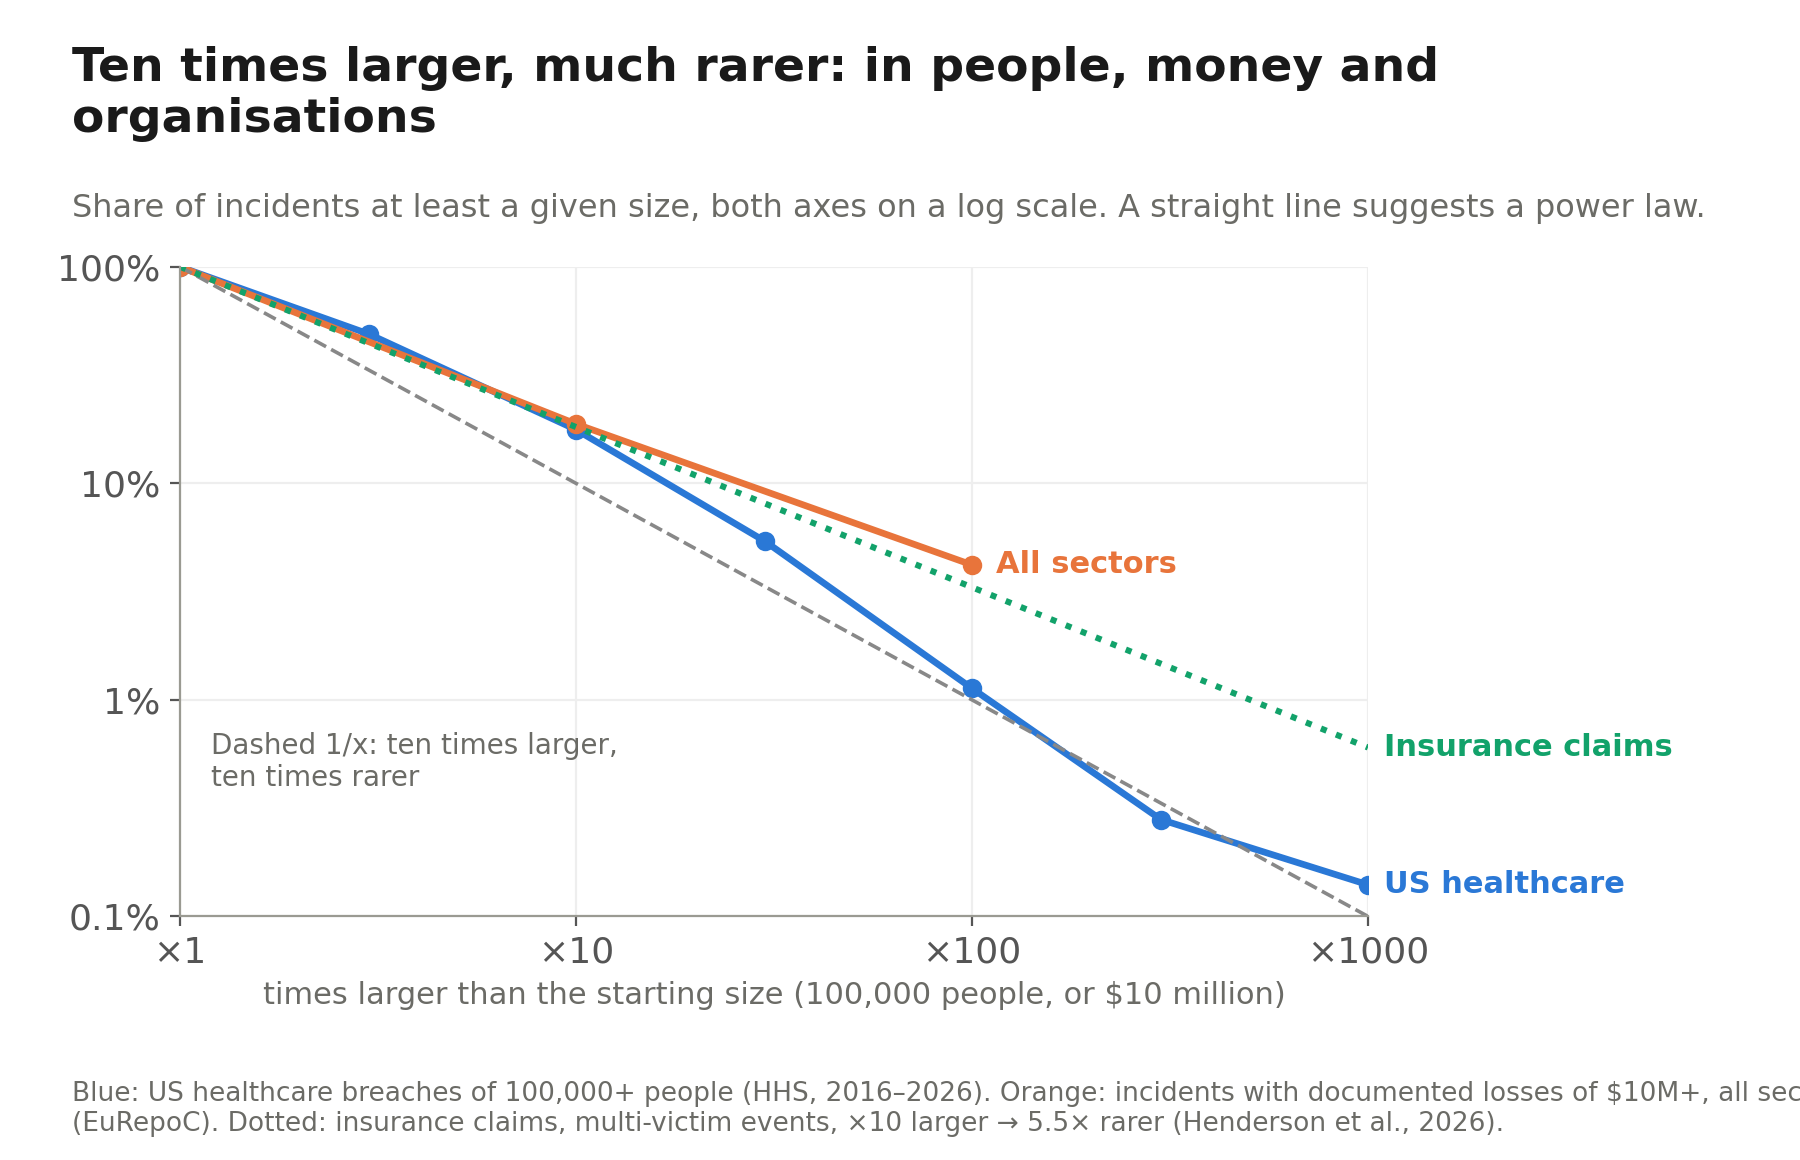
One breach, Change Healthcare in 2024, exposed 192.7 million people: 22% of all people counted in US healthcare hacking breaches since 2016.
An independent study of cyber insurance claims (Henderson et al., 2026) finds the same kind of heavy tail, even heavier for events that hit many organisations at once: each tenfold step up in size is only about 5.5 times rarer. Our own count of documented losses in EuRepoC gives a similar slope.
A vulnpocalypse would only grow the breaches that start with a vulnerability. If exploitation doubled, US healthcare would see 22 to 26 breaches of a million people or more a year, instead of 19. For the giants, the odds look like this:
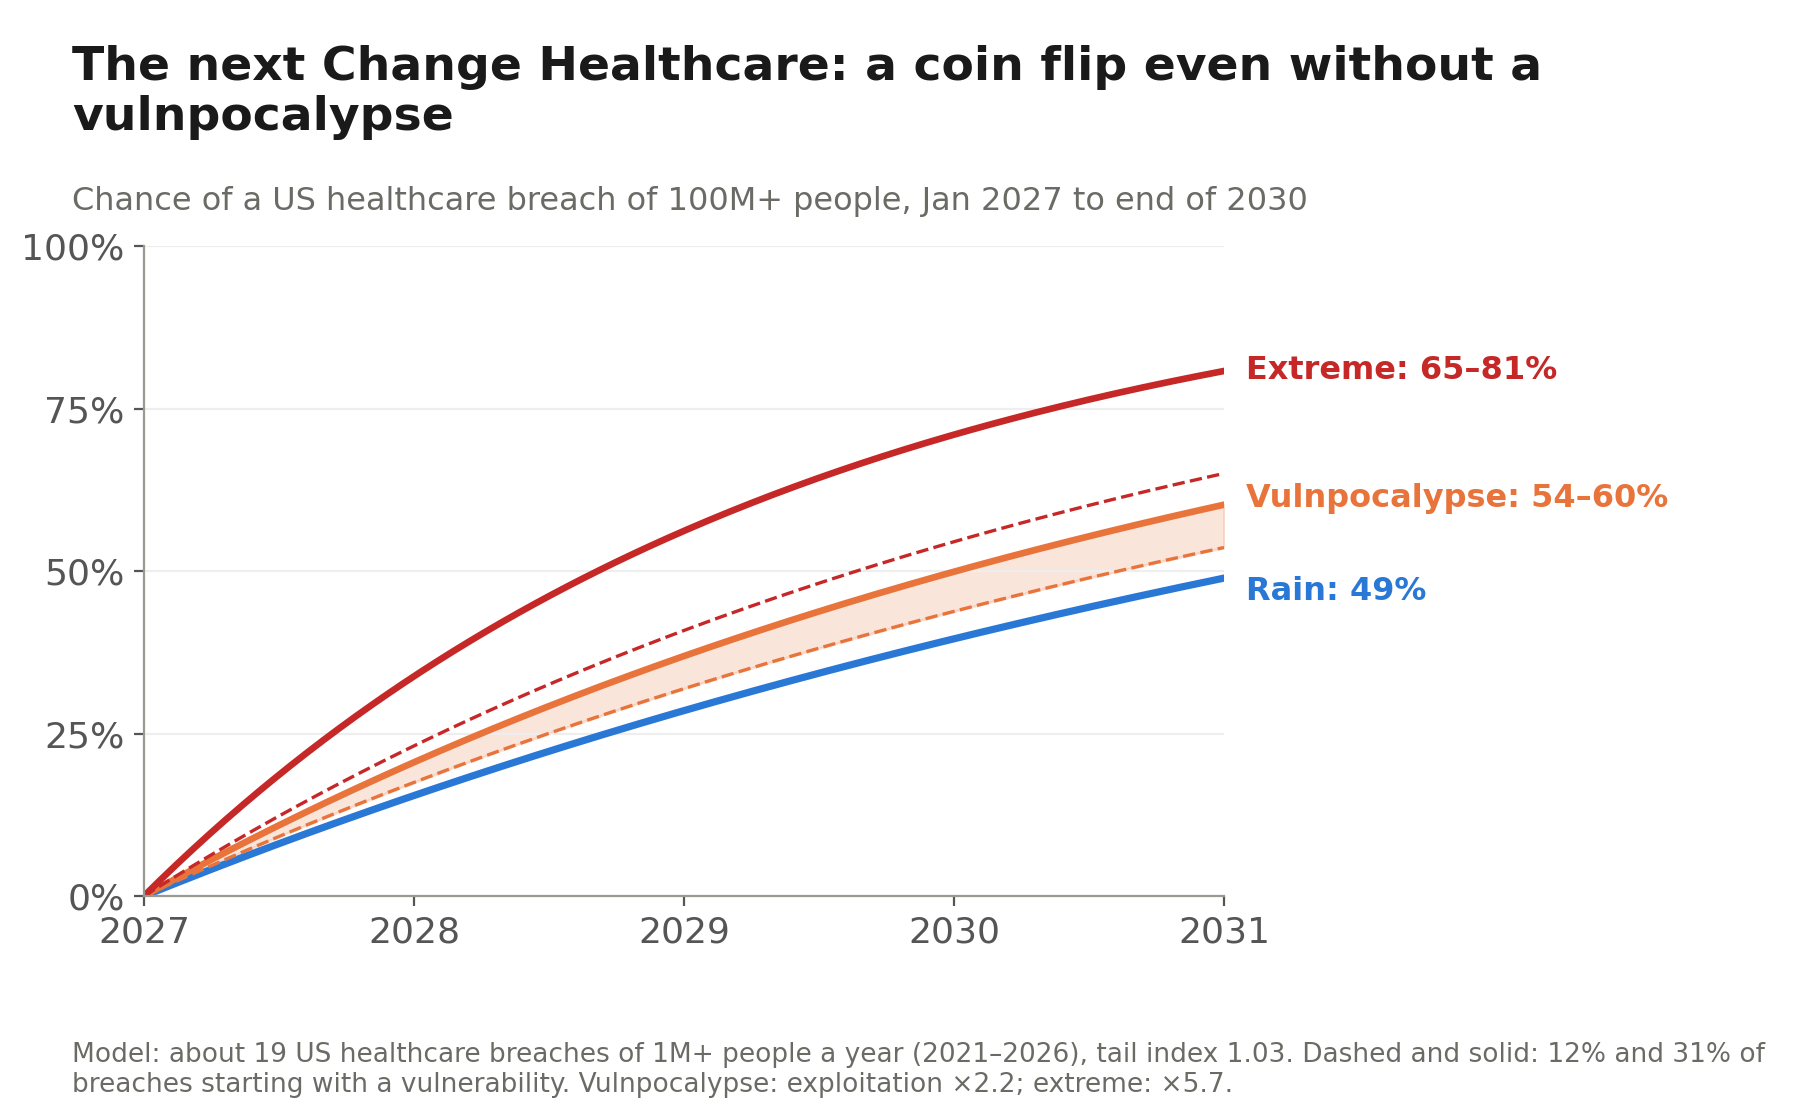
Even without a vulnpocalypse, another US healthcare breach of 100 million people before 2031 is roughly a coin flip. With one, the odds rise to 54–60%. And the baseline itself can move: if it rose from 19 to 25 breaches of a million people or more a year, the odds without a vulnpocalypse would go from 49% to 59%.
Most fires are small
The registries in this article only see fires big enough to report. Below that line there are far more small ones.
| Kind of fire | How common | In our data? |
|---|---|---|
| Attacks and incidents stopped in time | 43% of UK businesses a year, 65–69% of medium and large ones | No |
| Small breaches, under 500 people | About 100 for every reported one in US healthcare | No |
| Reported breaches, 500+ people | 600–700 a year in US healthcare | Yes |
| Mega-breaches, 1M+ people | About 19 a year in US healthcare | Yes |
US healthcare files 64,000–74,000 reports a year of breaches under 500 people, affecting fewer than five people each on average. Most are mistakes rather than hacking, such as a letter sent to the wrong person, but they show how much happens below the line.
So a low chance of a reported breach does not mean a low chance of being hacked. Most companies will be attacked every year, and many will have small breaches. What the forest decides is whether a strike stays a small fire or becomes a big one.
One lightning, many fires
One bug can start hundreds of breaches when many companies share the same software. MOVEit, a file-transfer tool, is the clearest case.
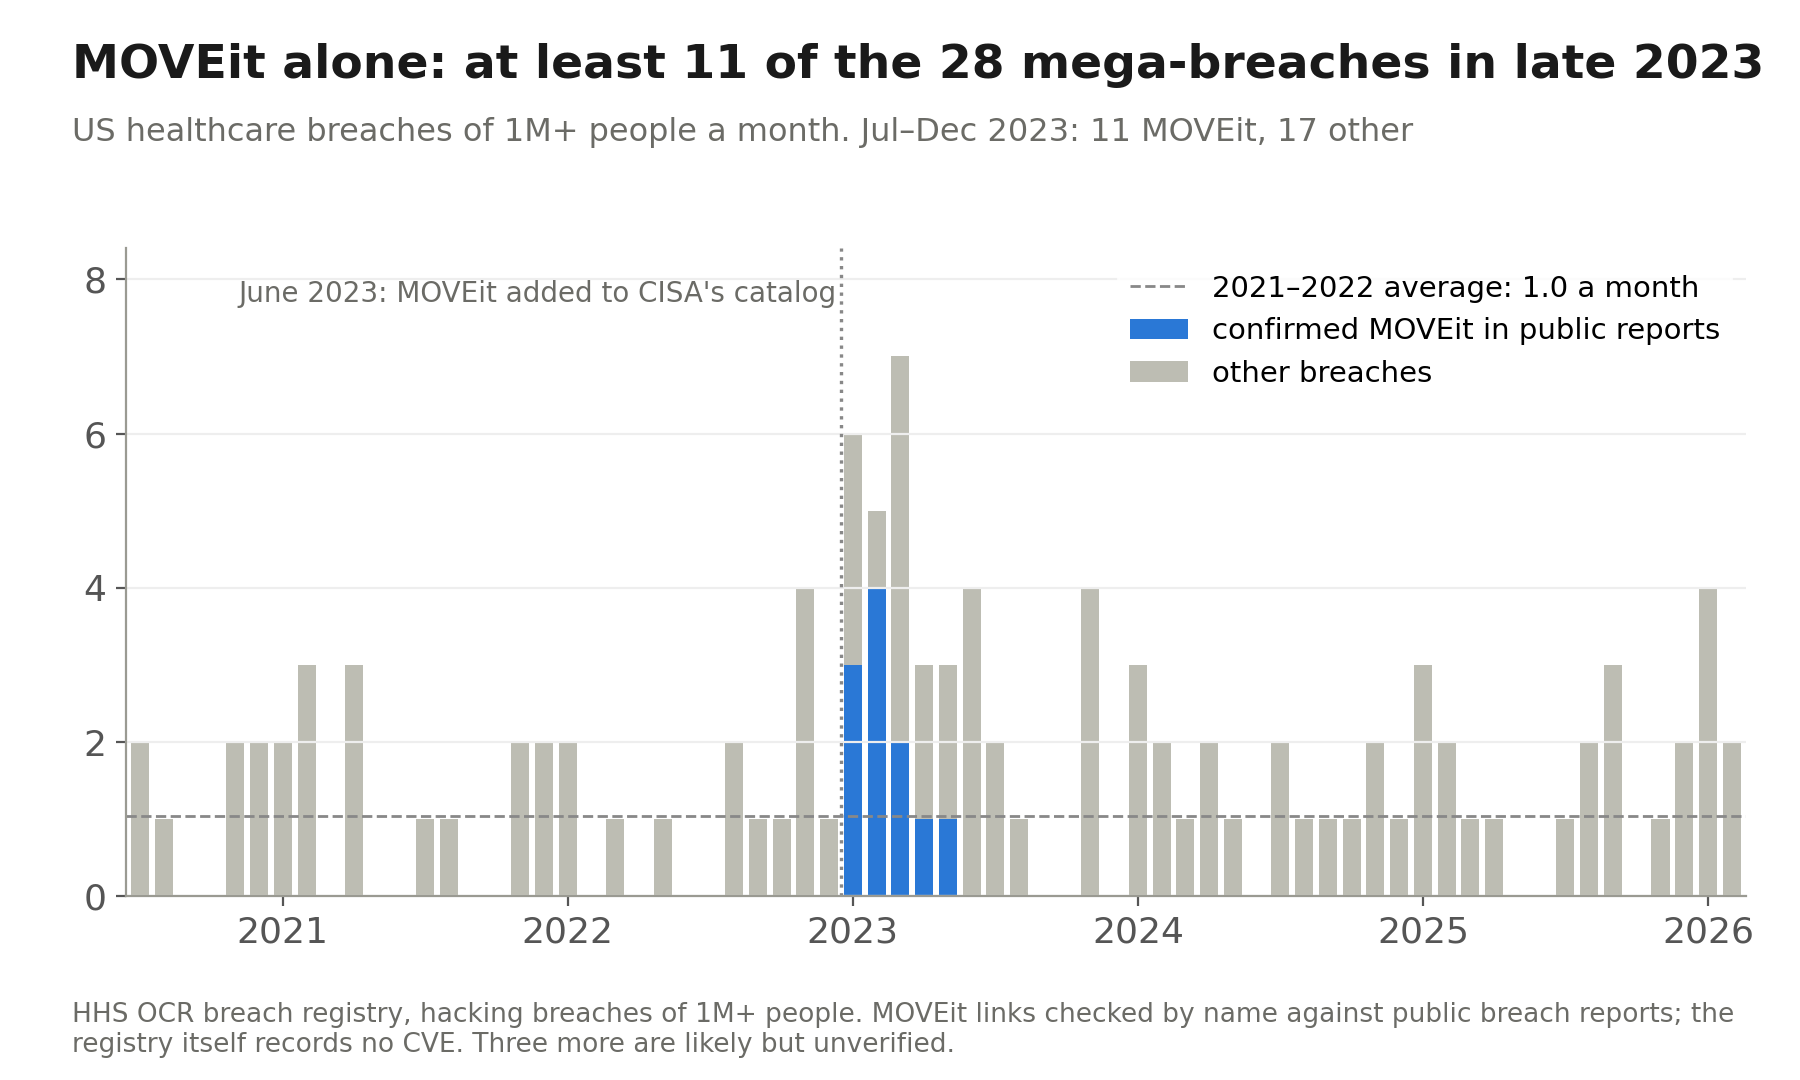
In the six months after MOVEit was hit in mid-2023, US healthcare saw 28 breaches of a million people or more. At least 11 were MOVEit, including its three largest victims: Maximus, Welltok and Delta Dental of California. Attacks began before a patch existed, so no one could win the patch race.
Shared software is what connects the trees. Physicist Didier Sornette calls outliers like this dragon kings: events bigger than even a heavy tail predicts, because a different mechanism makes them. Counted as one event, MOVEit hit about 96 million people across more than 2,700 organisations. Whether it is a true dragon king is still open: an insurance study of more than 150 events that hit many organisations at once found MOVEit to be the largest, yet still on the same power-law curve as the rest (Henderson et al., 2026). Cascades may be the tail itself rather than outliers above it.
Why not Log4j? When it broke in December 2021, far more systems were exposed than MOVEit ever touched. Yet US healthcare saw no rise in mega-breaches afterwards, and in EuRepoC Log4j appears mostly in state espionage, with no documented losses. The data are thin, though: many Log4j break-ins were probably small, never documented, or stopped early by defenders, and fires like that never reach the registries. Log4j was a storm over the whole forest that fell mostly on wet trees: by most accounts it was patched or blocked unusually fast, and each break-in still had to find its own way to the data. MOVEit was one strike into a dry, connected pile: a single gang turned it into a data-theft production line across hundreds of customers. What makes a dragon king is not how many systems a bug touches, but whether attackers can turn one entry point into mass theft.
Other candidates in EuRepoC fit the same pattern. A Barracuda email-gateway zero-day in 2022–2023 reached more recorded victims than any incident except MOVEit, but it was used for espionage. The 2025 Salesloft breach reached data at dozens of companies through stolen app tokens and involved no CVE at all: a cascade that public vulnerability data cannot see.
Of the four largest cascades of 2020–2024 in that insurance study, only MOVEit clearly ran through a CVE. Change Healthcare began with stolen credentials, by UnitedHealth's account; CDK Global's entry route has not been confirmed publicly; and CrowdStrike was a faulty update, not an attack. Vulnerabilities are one way a cascade starts; shared technology is what lets it spread.
For a smaller company, such a wave usually arrives through its suppliers, not its own code. Suppliers reach you in two ways. Their software runs in your network, as MOVEit did for many victims: that is the same two races as any vendor bug, the vendor's discovery race and then your patch race. MOVEit was lost in the first one. Or they hold your data and get breached themselves, as when ransomware hits a billing partner or a SaaS platform: then none of your own defences applies. Verizon's 2026 report found a third party involved in 48% of breaches, counting both. The second kind is the heavier one: in US healthcare since 2021, vendors holding patients' data reported 17% of hacking breaches themselves and were involved in 37% in all; that 17% alone accounts for 60% of the people affected and 46% of the breaches of a million people or more.
What to do, in order
Zero-days are not most companies' biggest risk, so the order matters.
- Close the front door. Use phishing-resistant sign-in and good password hygiene. More breaches start there than anywhere else.
- Win the patch race. Patch exploited bugs and internet-facing devices first, including suppliers' software you run, such as file-transfer tools. Today companies take a median of 43 days to fully fix a known exploited bug.
- Run your own discovery race. No vendor scans your own code. Point AI at it, including code written with AI, before attackers do.
- Limit the burn. Keep less data in one place, segment your network, and stop attacks before the data leaves. Know which partners and SaaS vendors hold your data, share less with them, and check how they protect it: there, your own firebreaks do not reach.
The lesson. For vendor software, vendors and outside researchers do the finding, increasingly with AI; your job is to patch fast. Your own code is yours alone to scan. And since some lightning always gets through, tend the forest, not just the sky, including the parts that grow on your suppliers' land: AI changes how often lightning strikes, but the forest decides how much burns.
These numbers show how risk is structured and how it shifts, not a forecast for any one company.
For those who model risk
The useful question is not how many CVEs AI will produce, but how it changes the payoff of each defence. In the model, for a mid-size company, counting the breaches that start with a vulnerability:
| Improvement | Breaches through vulnerabilities, today | If attackers get six times faster |
|---|---|---|
| Patch in 7 days instead of 43 | −20% | −13% |
| Own-code scanning: basic to AI-first | −9% | −31% |
| Hardening: basic to segmented | −52% | −52% |
| SOC: business hours to 24/7 | −42% | −19% |
| Data governance: basic to strict minimisation | 0% (−71% for large breaches) | 0% (−71% for large breaches) |
AI-first scanning of your own code gains value as attackers speed up. Faster patching and a 24/7 SOC lose some of theirs, because attackers turn patches into exploits faster and move faster once inside. Segmentation and data minimisation keep their value at any level of attacker AI: they limit the size of the fire, not the race. Across all causes the effects are smaller, since vulnerabilities start only a share of breaches; there, segmentation cuts the total by about a third, and a 24/7 SOC and phishing-resistant sign-in by about a quarter each. The exact sizes depend on assumptions; the direction is the point. The simulator lets you test your own mix.
What would prove it wrong
A model is only worth something if it could fail. Some 2027 numbers would break this one; others would mean that the vulnpocalypse it describes has started.
What would prove the model wrong
| Signal | The model expects | It is wrong if |
|---|---|---|
| Zero-days at the six big vendors, over four quarters | Flat, about 8–9 a quarter | They grow as fast as everyone else's |
| Zero-days at all other vendors, relative to the six | Settles well above the six | Falls back to level, as in 2025 and early 2026 |
| Breaches through companies' own web applications | Rising as attacker AI spreads | Flat or falling |
What would mean the vulnpocalypse has started
| Signal | Today | Warning sign |
|---|---|---|
| Share of big vendors' new CVEs that get exploited | About 4 per thousand | Back above 10 per thousand |
| Time from publication to exploitation, n-day bugs | Median 36 days | Well below that |
| US healthcare breaches of 1M+ people | 19 to 26 a year | Above 26 for two years, not explained by one cascade |
For readers who want the math
The rest is for readers who want to check the numbers.
How sure are we
Read the model as a map of how risk is structured and how it shifts when something changes. The shape comes from the data; the absolute levels depend on calibration and assumptions.
| Kind | Examples |
|---|---|
| Measured in public data | CVEs ×3, exploited bugs flat, breaches flat; the ten-times rule for breach sizes |
| Calculated by the model | Zero-day risk ×2.2–2.8 or ×0.04–0.05; 22–26 mega-breaches a year; the odds of the next Change Healthcare |
| Inferred indirectly | MOVEit's share of the 2023 spike, checked by name for the largest breaches only |
Seven limits to keep in mind:
- Breach counts come from US healthcare. The shape of the tail likely holds elsewhere; the exact numbers may not.
- CISA's list is late and incomplete. A bug appears there only after someone detects its exploitation.
- More CVEs is not purely more AI. Part of the rise may be changes in how vendors register bugs.
- No registry links breaches to the bugs behind them. Links like MOVEit's have to be checked by hand.
- The claim about your own code is the least proven. Public data cannot see custom code, so it rests on the model and indirect signs.
- Only reported fires are counted. Breach counts and odds refer to breaches of 500+ people. Attacks, contained incidents and small breaches are far more common and are not in the model.
- Breaches at partners and SaaS vendors are only roughly modelled. The simulator has a supplier channel calibrated to US healthcare data, in which your own defences play no part; its share is an assumption.
How the numbers were made
- Exploited bugs. Each CVE is matched to CISA's list by its ID. "Added within 90 days" counts days from publication to listing. Only months whose 90-day windows had closed by 30 September 2026 are compared, so April–June.
- Zero-days. Bugs listed on or before the day their CVE went public: 19% of entries added since 2022, 31% for CVEs published in 2023–2025.
- Breaches. US healthcare hacking breaches of 500+ people, 2016 to mid-September 2026. People affected are summed across reports, so one person can count twice.
- The heavy tail. Fitted by maximum likelihood. Above about 264,000 people, the number of breaches of size x or more falls roughly as 1/x; a lognormal curve fits about as well.
- Vulnerability share. 12% is the share of EuRepoC incidents coded as vulnerability exploitation; 31% is Verizon's share of breaches that began that way. Different definitions, so they are two anchors rather than one measured range.
- Uncertainty. Shares come with 95% intervals from a Beta distribution, a standard way to put error bars on a proportion. The known-exploited share fell from 12.3 per thousand (7.1–21.4) to 4.3 (2.5–7.4). The chance that it really fell is over 99%, and the drop is most likely about threefold (anywhere from 1.3 to 6 times). The zero-day share is 19% (17–21%) for entries added since 2022 and 31% (28–36%) for CVEs published in 2023–2025.
The discovery race treats attacker and defender as two independent searches for the same bug. If AI makes the attacker m times faster and the defender D times faster, and today attackers win a share z₀ of races, the attacker's share p and the zero-day risk R relative to today are:
p = m·z₀ / (m·z₀ + D·(1 − z₀))
R = (p / z₀) / D
The mega-breach scenarios count breaches of x people or more per year. λ₁ is the yearly number above a million people: about 19, the 2021–2026 average. It varies from 10 to 37 from year to year and has risen since 2016, so it should be re-estimated each year. Only the share s of breaches that start with a vulnerability grows, by g, the growth in exploitation:
Λ(≥x) = λ₁ · [(1 − s) + s·g] · (x / 10⁶)^(−1.03)
The chance of at least one such breach within t years is 1 − e^(−Λ·t).
Sources
- CVE List v5, snapshot of 1 October 2026
- CISA Known Exploited Vulnerabilities, 30 September 2026
- HHS Office for Civil Rights breach portal, to 15 September 2026
- EuRepoC, records to 26 September 2026
- Root Evidence, The Vulnpocalypse Report, September 2026
- Verizon DBIR 2026, via watchTowr
- Dark Reading: The Vulnpocalypse Is Repricing the Bug Bounty Economy, 28 August 2026
- Henderson et al., Simplifying Cyber Cat(astrophe)s with Cyber Kittens: Power Law Plausibility for Cyber Insurance Risks, arXiv, 9 September 2026
- HHS OCR Annual Report to Congress on Breaches, 2024, with the 2021 and 2022 reports: breaches under 500 people
- UK Cyber Security Breaches Survey 2025/2026, Department for Science, Innovation and Technology
- Cyentia Institute, Information Risk Insights Study (IRIS), 2020 and 2025: annual chance of a publicly known cyber event by company size
- HIPAA Journal: CMS and Wisconsin Physicians Service MOVEit breach
- TechCrunch: Microsoft cites AI for record patch count, 15 July 2026